Getting Started with ecFlowUI
Starting ecFlowUI
The command to start the application on the ECMWF HPC:
module load ecflow/new
ecflow_ui
Warning
This version should only be for testing the new user interface and not for running a server!
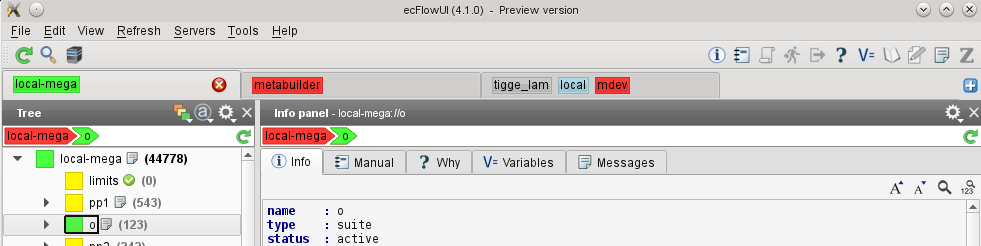
Starting ecFlowUI for the first time
When starting ecFlowUI for the first time, the application contains an empty tree view:
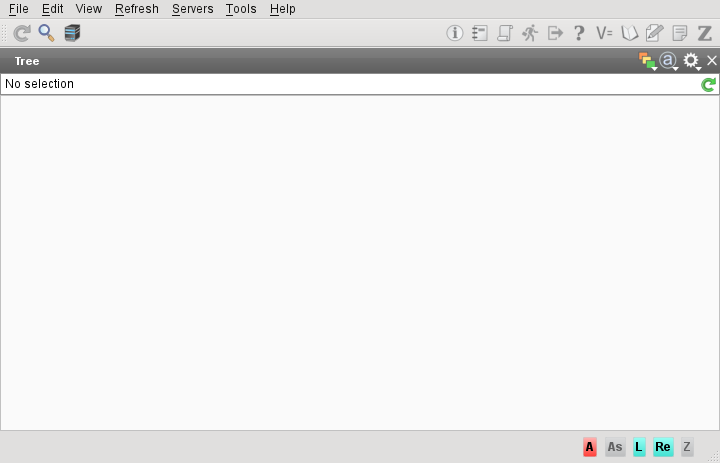
The first thing to do is to populate it with servers.
Go to the Servers menu; this should contain all the servers that you have configured for ecFlowview (these are copied over once, when you first start ecFlowUI; from then on, the two lists are not synchronised).
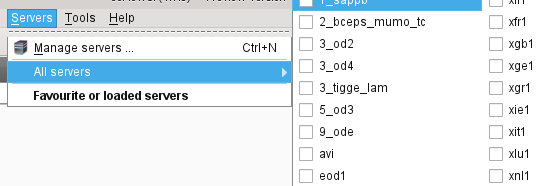
New servers can be added by selecting Manage servers. This dialogue is also where servers can be set as favourites for easy access.
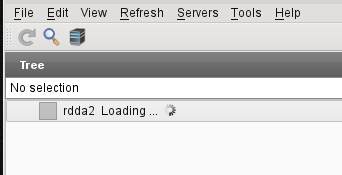
Selecting a server will add it to the tree view. For large servers, a Loading indicator may appear, but the user interface is still responsive.
Once loaded, a server appears in the tree view. Server and suite nodes show, in brackets, the total number of children under them. Any number of servers can be added to the view.
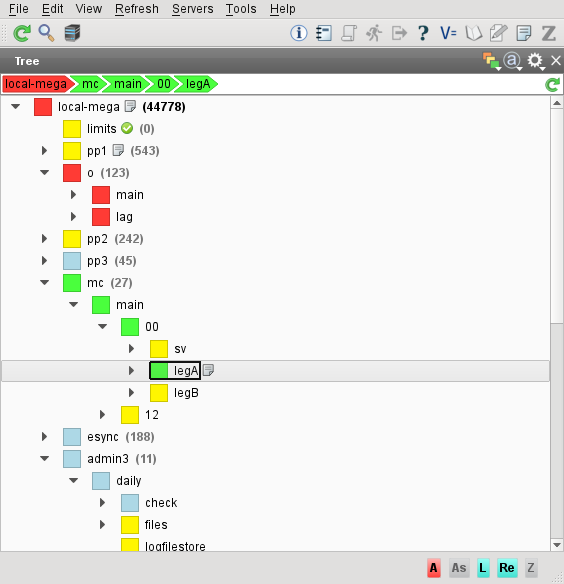
Viewing the tree
The tree nodes are expanded and collapsed using the small icons to the left of each node. Alternatively, double-click on the node name.
At the top of the tree is a set of breadcrumbs, showing the hierarchy up to the currently-selected node. Clicking on a node in the breadcrumbs will select the node in the tree.
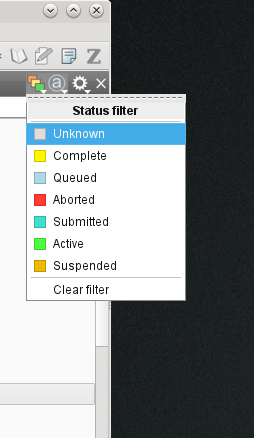
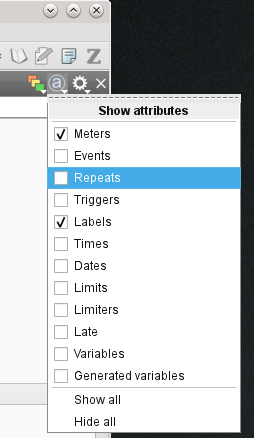
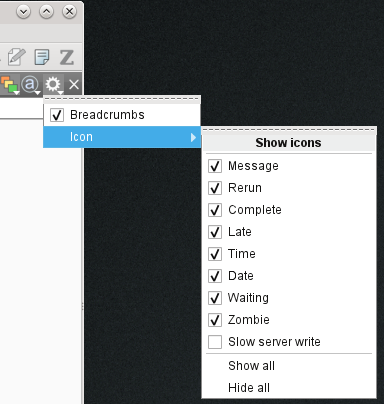
At the top-right of the panel are three icons which give access to:
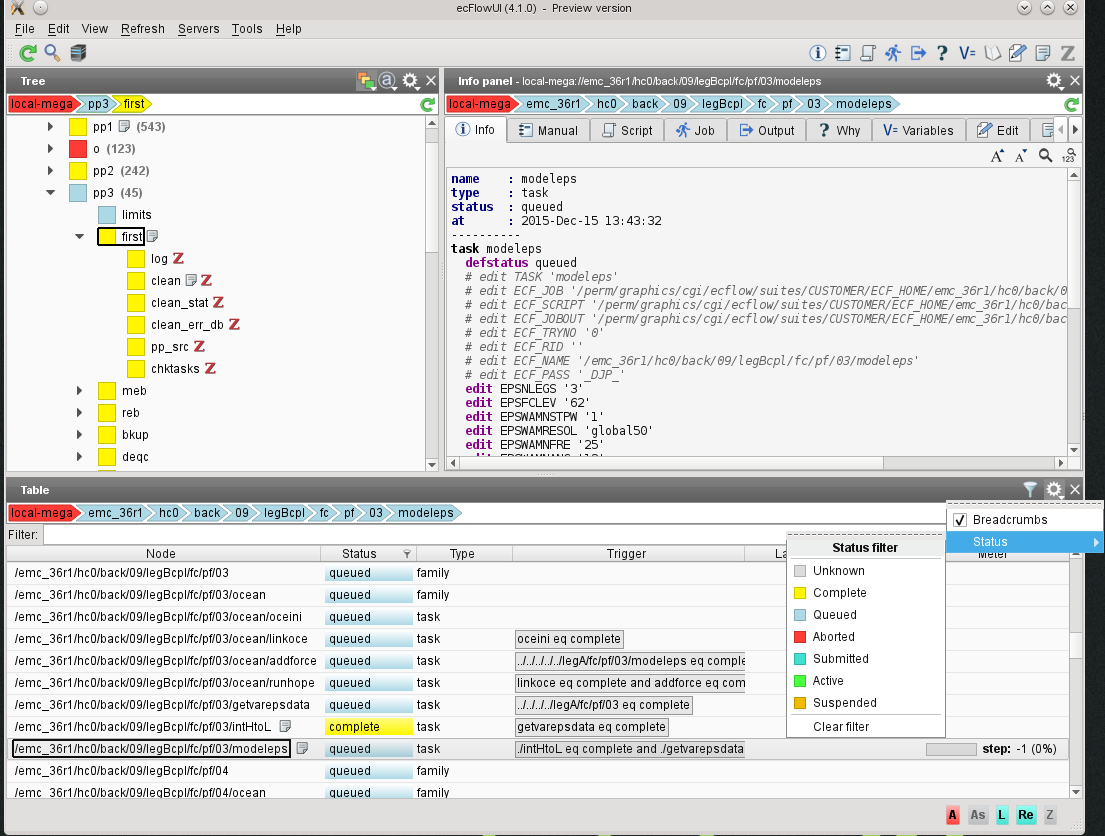
Status filter (show only nodes with the selected statuses)
Show attributes
Show icons
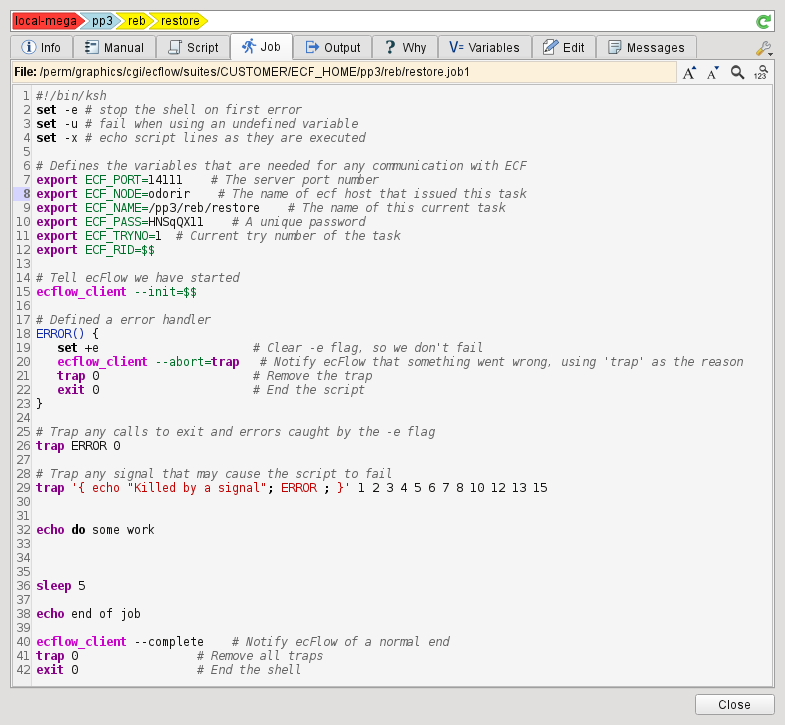
When a node is selected, the toolbar at the top of the tree view has a button which reveals options to display various information for the selected node, such as Output and Script. Clicking one of these pops up a floating Info Panel displaying the selected information in a tab. Which attributes are shown by default can be changed from the Edit > Preferences menu.
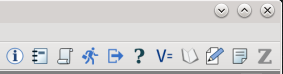
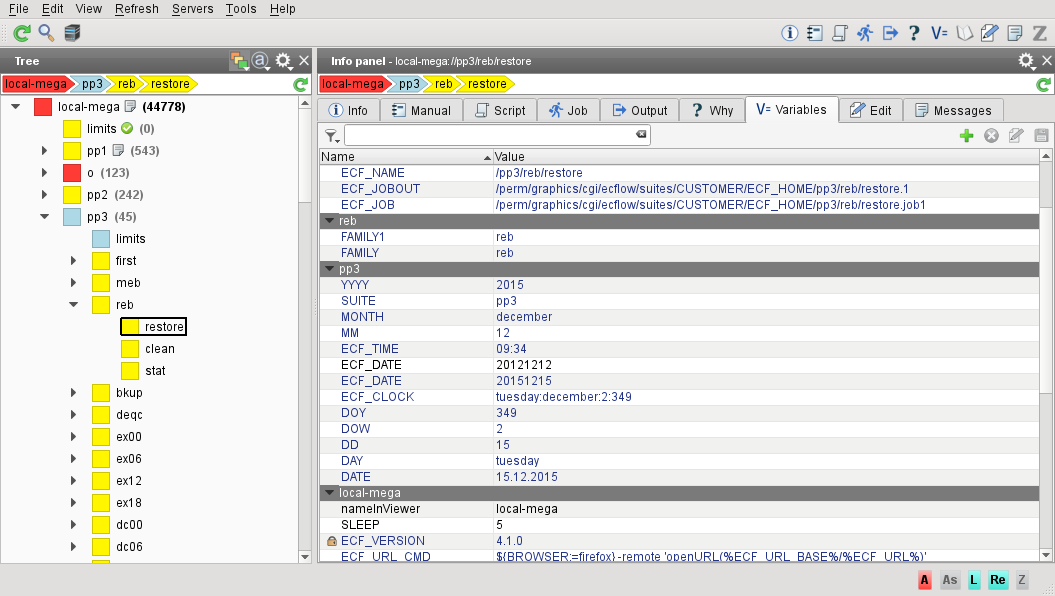
Node Information
At the top-right of the window is a group of icons - click on one of these to obtain a floating information panel for the currently-selected node. The panel is “detached” by default, meaning that its contents will not change if a different node is selected.
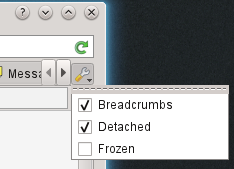
The panel can be detached or frozen by using the configuration menu at the top-right of the panel:
It is also possible to have a permanently docked Info Panel: select Add info panel from the View menu.
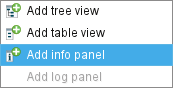
The information panel appears at the bottom of the window.
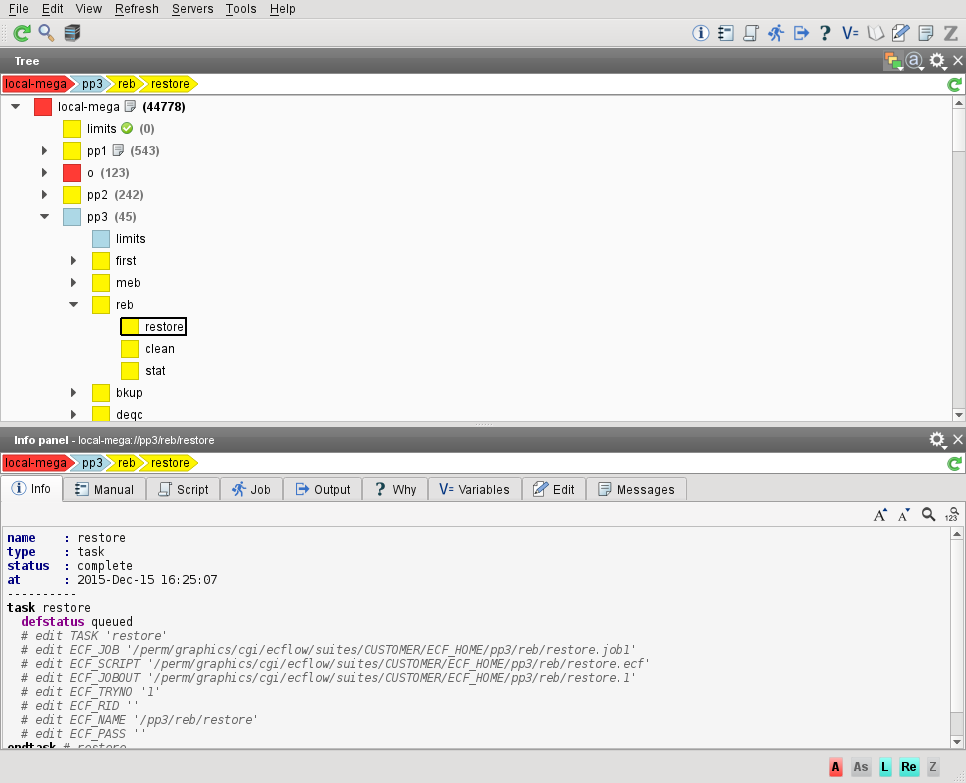
This docked information panel is linked to the currently-selected node, but can also be detached and frozen using the configuration menu at the top-right of the panel.
Layout
Each panel in ecFlowUI is resizeable and moveable, following a dashboard approach. For example, drag the information panel to the right of the tree view to get an arrangement like this:
Interacting with the servers
In the tree view, the right-click context menu provides most of the standard commands. Hovering over a menu option shows, in the status bar, the command that will be sent to the server.
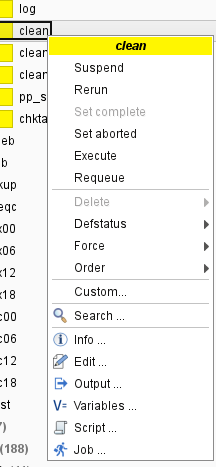
It is possible to select multiple nodes with the mouse and select a command which will be sent to them all. Also, using the Custom… menu entry, any command may be typed in.
Configuration and setup
The list of available servers can be managed through the Servers > Manage Servers menu.
Global server settings, notifications settings plus other settings such as colour setup and fonts, can be found in the Edit > Preferences menu.
Settings per server can be found in the Information panel, in the Settings tab (when a server node is selected in the tree).
Table view
From the toolbar at the top of the window, a new Table View panel can be added. This provides an alternative, flat, way to view the nodes, and allows sorting and filtering of nodes. This feature is still experimental and is known to be slow when acting on large servers.
Tabs and windows
ecFlowUI supports multiple windows and multiple tabs, available from the File menu. Each tab contains its own list of active servers, and the tab control itself shows the status of each server in that tab.
Likewise, each window is separate from the other windows, each containing their own set of tabs and therefore servers.